While it might seem that sensor data analytics' primary task is to gather information, its true purpose is always to guide decisions. Whether that means streamlining processes, improving efficiency, or uncovering new revenue streams, the focus remains on actionable insights. The relevance of IoT development is growing in various industries, as sensors carry out essential functions and gather vast amounts of data for businesses. However, metrics and measurements have value only if they help resolve real-world issues or spot opportunities for innovation. Let's explore how to build a sensor data analytics system that transforms data points into business value:
Strategy layer: Converting business needs into technical requirements
Data analytics is a powerful tool for decision-making. However, it’s important to remember that machines and algorithms operate strictly according to the instructions and data they are given—they don't possess the human ability to infer or apply common sense. This means that when designing a sensor data analytics system, every aspect of the business need must be carefully translated into clear, precise technical requirements.
What does making a decision consist of? First, there must be a clear set of options to choose from. Let's use a simplified example of choosing what to wear to illustrate the principle: there's a closet full of items that vary in warmth and formality; which should be chosen? Second, there must be a guiding question or condition that helps you decide which option is correct—"What is the weather like? How formal is the occasion?" Finally, there must be real-life inputs that answer that question, such as the temperature, the chance of rain for that day, and the type of activities planned. This same pattern holds for any decision: starting with options to decide between, specifying the guiding question, gathering relevant data from the real world, and using that information to select the best path forward. A good data analytics system thus states a question that comprehensively informs the decision, collects inputs that accurately reflect the real world, and processes them in a way that truly answers the question.
To better understand effective systems, let's understand how a system can fail. One way to frame a question too narrowly failing to capture all facets of a decision. If the system for choosing an outfit focuses exclusively on the temperature, it might suggest wearing a full suit to the grocery store. Another point of failure may occur in how inputs are collected. For example, the temperature has to be measured outside, not indoors. There is further complexity in how the collected data should be processed. How many data points for temperature and precipitation should be considered, and how should they be weighted? Using a single point from 2 pm will not inform the decision appropriately if there is a 90% chance of rain at 4 pm.
Output: Decision
The system can either automate a process completely or alert and inform human decision-makers. In manufacturing, sensors can remove products found faulty from the assembly line or suggest that a piece of equipment be scheduled for maintenance. Similarly, in vehicles, sensors can warn the driver about the state of some parts or detect obstacles on the road to trigger a collision-avoiding mechanism. From the analytics system's perspective, there's no difference between passing actionable insights to machines for immediate execution or translating them into human language for further consideration; its purview ends with data analysis.
Data analytics: Question
Does a product meet the quality standard? Is a machinery part behaving irregularly? Is there an object in the way? Answers to these questions have to be defined as a function of multiple sensor inputs. The goal of data processing is to turn raw data sets into meaningful statements. When monitoring a machine part, parameters such as vibration levels, temperature, or pressure readings can collectively indicate deviations from normal conditions. In patient assessment, the critical state should be determined by combining vital sign thresholds for heart rate, position, blood pressure, and oxygen saturation.
Hardware: Input collection
Sensors must be built and placed to represent the data needed to answer the question accurately. If the sensors do not capture the right variables—or if they capture them from a poor vantage point—the entire analytics pipeline can become distorted. This consideration should arise in the earliest stages of designing a product to ensure that the sensors are properly integrated into the overall system.

Now, let's shift from theory to practically building an effective sensor analytics system, from data collection through processing to decision-making.
Explore 6 disruptive IoT trends for 2026 and beyond—get the guide!
Success!
Sensor equipment layer: Designing sensor data collection
In countless use cases of sensor data analytics and across a range of industries, sensor placement and design must address environmental conditions, spatial constraints, relevant regulations, and data collection needs. Let's look at specific examples by industry:
Manufacturing
Sensor equipment in manufacturing faces two main challenges: harsh conditions and spatial constraints. Standard sensors can warp or fail very quickly due to vibrations, dust, pressure, or other externalities of machinery operations. Sensor devices must be ruggedized with temperature-resistant coatings, vibration-dampening mounts, and protective measures to withstand these environments. The placement of the device also needs to balance spatial constraints, damage protection, and regulatory requirements while ensuring effective range and clean data collection. For example, a vibration sensor on a rotor assembly should attach to the motor housing or a stable surface to avoid interruptions in the data and protect the sensor, but placing it too far can miss subtle mechanical fluctuations.
Explore applications of IoT in manufacturing
Automotive
Extreme heat, cold, dust, mechanical stress, interference with critical vehicle components, and compliance with safety regulations are all factors that affect sensor placement in a vehicle. Driver-assistance systems—such as radars and lidars, have to be placed and designed to capture the full picture around the vehicle and be protected from accidental obstructions like dust or snow. Protective housing and disturbance detection are necessary solutions to these challenges.
Logistics
When monitoring the temperature for transporting refrigerated goods, sensors should be placed where they can effectively monitor the entire storage area rather than being clustered around cooling units or other equipment. Other use cases must accommodate challenges with network coverage, regulatory requirements for protecting special goods, and others.
Healthcare
The design of the device must balance patient comfort and regulatory adherence. Wearables have to maintain skin contact without hindering movement. Additionally, sensor data collection in healthcare is a highly regulated area, and the placement and calibration of devices must adhere to the guidelines of the relevant jurisdictions.
Agricultural
Sensors in agriculture are exposed to weather changes, wildlife, and farm equipment. For instance, soil sensors must be buried at an optimal depth to capture accurate data while remaining safe from plows. Weather stations and crop-monitoring drones should be strategically placed to collect accurate data across large fields.
Once it is clear what data the sensor is collecting and how they can do it well, the next step is to determine where and how it is sent for processing.
Connectivity layer: Handling sensor data processing needs
Effective sensor data analytics requires smart data processing. Organizations must decide where to process the data collected from sensors and how to transmit it there—each option comes with trade-offs in latency, scalability, and cost. Making the right choice is crucial, as a suboptimal infrastructure setup can cause delays, high transmission costs, and missed opportunities to act on critical information.
Determining the processing needs
The first question to ask when determining a sensor processing system's connectivity needs is, "How often and how much data needs to be processed?" A sensor that produces high-resolution, continuous data will require a high-bandwidth connection and low latency (a measure of time between a data point being collected and its processing). Use cases that need small, infrequent updates don't require high connectivity and processing power, but they may have different needs.

For example, assembly line sensors that detect microsecond-level anomalies in vibration or temperature transmit medium-volume data at high frequencies. They require real-time processing capacity; however, because the volume of data isn't high, they can also enhance speed by incorporating built-in processing modules to filter the data before transmission. Another highly demanding use case of sensor data analytics is visual sensors on self-driving vehicles. They capture extremely high volumes of data that require real-time AI and ML processing.
Read more: IoT in smart manufacturing: Insights for enterprises
On the other hand, a soil moisture sensor only sends a small data packet once a day. It requires minimal bandwidth but reliable coverage; the challenge arises because the sensor is often located in remote areas, rarely covered by any network. Setting up a low-power wide-area network (LPWAN) is a common solution. It covers large distances and only powers up when the sensor is going to transmit its data package. This allows the sensor to stay connected and minimizes power consumption, so it doesn't need frequent battery replacement.
There are further important factors in determining the connectivity needs for sensor data processing. The environment in which the sensor operates can dictate how robust or interference-resistant the connectivity must be. Power constraints also matter, as some sensors rely on battery or solar power, which can limit continuous data transmission. Security requirements can add another layer of complexity if sensitive data must be encrypted or transmitted over private networks.
Choosing the location for data processing
The next choice is where to process the data; there are three main options: edge computing, on-premises, cloud-based servers, or a combination of any two.
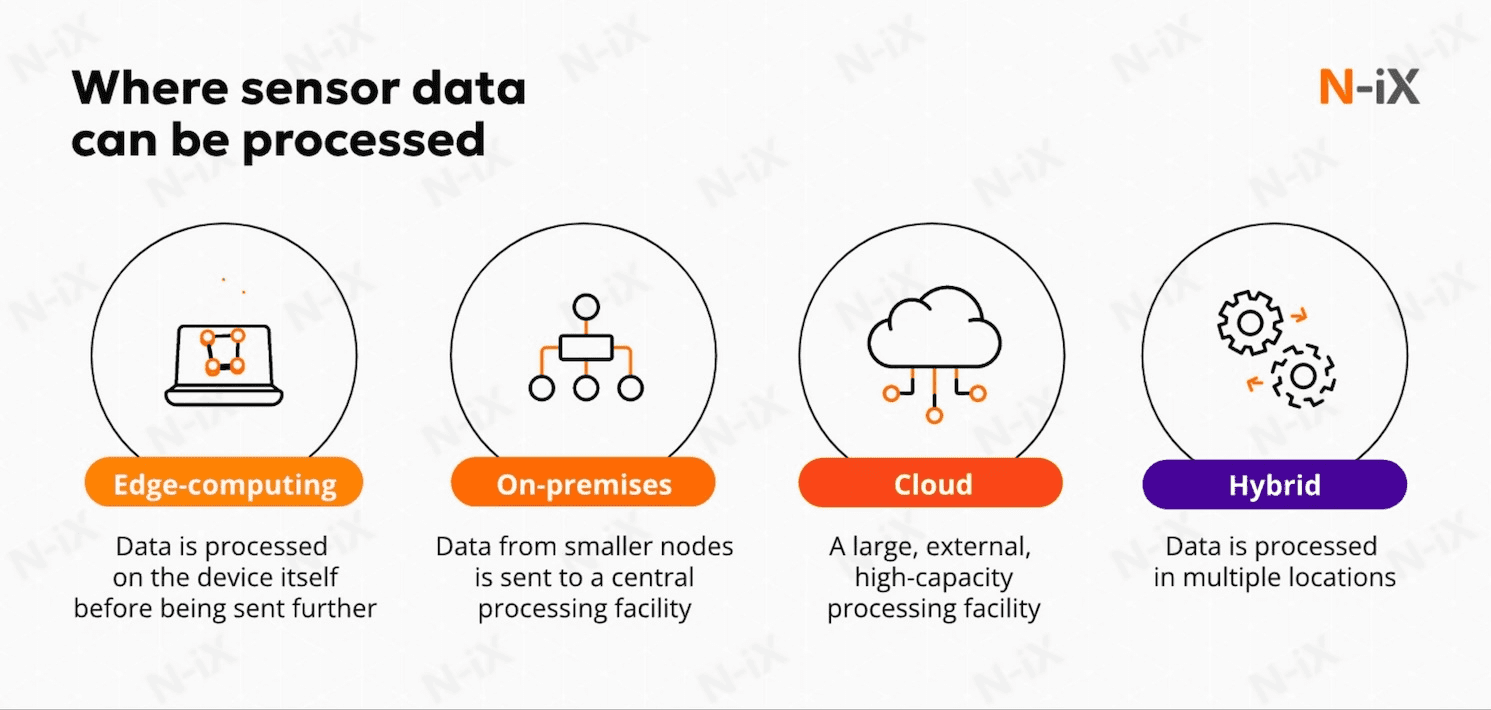
Edge computing processes data close to the data source, often on the sensor device itself or on nearby gateways. This minimizes latency, reduces bandwidth usage, and enhances data privacy by limiting the amount of sensitive information transmitted over networks. Edge computing offers faster response times, lower network dependency, and functionality in environments with intermittent connectivity. However, it also increases local hardware complexity, challenges in managing distributed resources, and higher initial costs for devices. Edge computing is best for real-time decision-making. Examples include industrial automation autonomous vehicles and healthcare monitoring systems that need instant feedback from wearable devices.
On-premises is a setup where sensor data is stored and analyzed within a centralized internal facility. It's most suitable for applications not highly sensitive to latency and where long-term storage, complex data integration, or comprehensive analytics are the goal. Its main benefits are enhanced control over data security and privacy, as well as the ability to integrate with existing enterprise systems. However, this approach also demands significant upfront investments in hardware and infrastructure while potentially failing to meet increases in processing needs due to network and processing delays in the centralized system. Detailed environmental data sensors, accumulated operational metrics, facility management systems, and comprehensive security surveillance systems are optimal for on-premises processing. In these cases, storing large amounts of data and performing complex, cross-referenced analytics is the goal.
Cloud computing is a model that enables organizations to access scalable computing resources on demand. These large facilities handle large data volumes and support complex analytics, making them ideal for use cases where flexibility, scalability, and remote accessibility are critical. Cloud services also include advanced tools for data analysis, machine learning, and integration, essential for extracting insights from complex sensor datasets. Security and data privacy are common concerns when entrusting sensitive data to third-party providers. However, major cloud providers have developed compliant environments and offer specialized services tailored for regulated industries. Predictive maintenance data analyzed with AI and ML tools or a global fleet of machinery management are best fit for sensor data processing in the cloud.
Most sensor data analytics systems use a combination of processing environments structured in layers. Simple tasks are handled locally, while complex analyses, such as time series analysis or predictive modeling, are offloaded to a powerful data processing center. For instance, a temperature sensor might process raw readings on-site to detect out-of-range values and trigger an immediate alert, while routine data is aggregated before being sent further upstream.
Data analytics layer: Translating data into action points
At the final level, data is refined, transformed, and analyzed to answer the question and make a decision. The goal is to detect anomalies, uncover patterns not visible from raw data, and forecast trends. Data analysts select the optimal statistical tools based on the mathematical properties of the data, as well as desired outputs, but it's worth it to map out the different approaches:
Descriptive statistics
Statistical analysis of sensor data starts with descriptive statistics, summarizing averages, medians, and standard deviations. These statistics help identify patterns and trends, providing a foundation for more complex analyses. For many sensor use cases, this simple form of processing is enough, such as traffic flow sensors installed at intersections or energy consumption meters.
Read more: Best practices for effective IoT data visualization
Statistical analysis
More complex methods include time series, regression, clustering techniques, and more. They go above the raw data transform and combine it into new, more abstract (or even immeasurable) parameters. For instance, time-series analysis can reveal trends or cycles over time that translate basic readings like temperature or pressure into a more meaningful parameter, such as a forecast of future spikes. Regression methods might combine multiple variables—vibration, speed, and temperature, for example—to produce a single "wear index" that estimates how close a machine is to requiring maintenance. Clustering techniques can group data points according to their similarities, effectively assigning each sensor reading to a specific behavior category that wasn't part of the original measurements.
Dive deeper: Sensor Fusion and explained
AI and ML
AI and ML are the most powerful data analytics tools, yet their power does not necessarily mean they are always the best choice. Neural networks are different from other statistical tools for two main reasons: they learn patterns by themselves without needing preprogrammed rules, and they can process data like pictures or sounds, which traditional methods struggle with. This flexibility makes them ideal when variable relationships are complex or non-linear. For example, autonomous vehicles use neural networks that recognize objects from visuals and predict their behavior in real-time. However, neural networks require large amounts of training data and substantial computational power, which may be overkill for simpler tasks handled well by traditional methods. They also operate as "black boxes," making their decisions less transparent—an issue in industries where interpretability is vital.
N-iX's take on sensor data analytics
N-iX provides full-cycle hardware and software development services for IoT and sensor data analytics, ranging from product discovery to support in sensor manufacturing, ensuring security and acquiring certification, automating tests, and data management. With a team of over 200 data experts and 400 cloud experts, N-iX builds robust, secure, efficient, and scalable solutions for your sensor data analytics needs.
N-iX has extensive experience with sensor technology, particularly in IoT and embedded solutions. For instance, we have developed systems that monitor energy efficiency in real-time by collecting, storing, and analyzing sensor data. In another project, we worked with an international company that offers smart telematics solutions for efficient fleet operation and management. Our team contributed to the development of an OEM-based connectivity gateway that monitors and manages vehicle activities tracked by a GPS system. The data is transmitted from each vehicle to the owner and converted into useful information, including vehicle traveling speed, fuel consumption, engine efficiency, and more.
Read more: Improved efficiency and customer reach with IoT fleet tracking
In another project, we collaborated with an Australian company that produces air decontamination devices for the healthcare industry. These devices detect airborne contaminants, purify the air, and neutralize viruses and bacteria. N-iX engineers created a cross-platform mobile app to monitor air quality and system performance. This enhanced system reliability, stable operation, and an intuitive interface.
Read more: Embedded and mobile development for a decontamination system manufacturer

At its core, sensor data analytics is bridging the gap between the physical and digital worlds. Our software architects and engineers help clients apply the latest innovations, such as IoT and ML, to solve real-life business problems. These technologies turn daily hardware operations into strategic assets and competitive advantage.
Have a question?
Speak to an expert